die echtzeitanalyse
Dashboard for a real-time analysis of website traffic
Developing a web application with cp was agile collaboration in the best sense of the word: a structured approach combined with great openness to customization, genuine interest in the users' needs, direct communication, reliability, and — most importantly — humanity.
Luise Strothmann
Project coordinator, taz
Together with the German daily newspaper tageszeitung (taz) we created a real-time analysis dashboard for website traffic. It is used internally to visually represent evaluated web server logs for the persons responsible for the website content and allows them to control the website in a more efficient manner.
Project’s purpose
A core objective was to reduce the visual content to the absolutely essential,
in order to keep the attention of the users as focused as possible.
This was the main reason to strive for an own development instead of
relying on one of the existing dashboard solutions.
Common dashboard functions, such as real-time refresh, comprehensive graphs and charts,
as well as persistence and sharing of filter and view configurations were also part of the requested feature set.
Technologies
To implement the tool in a cost efficient manner, we used open source frameworks where possible and justified, such as VueJS for the state management together with ChartJS for the graph visualization in the front-end and django for the REST-API in the back-end. The back-end served here as a mediator between the front-end and the data source (Elasticsearch).
Challenges
Evaluating the webpage accesses in a way which strongly complies with data protection best practicies was also one of the reasons why an in-house development was necessary. Instead of using one of the usual tracking tools (for example Google Analytics), the taz only evaluates webserver logs and stores them for further analysis in Elasticsearch for a limited period of time. To interpret this data, a little bit of specific logic was needed, which we realized in the back-end.
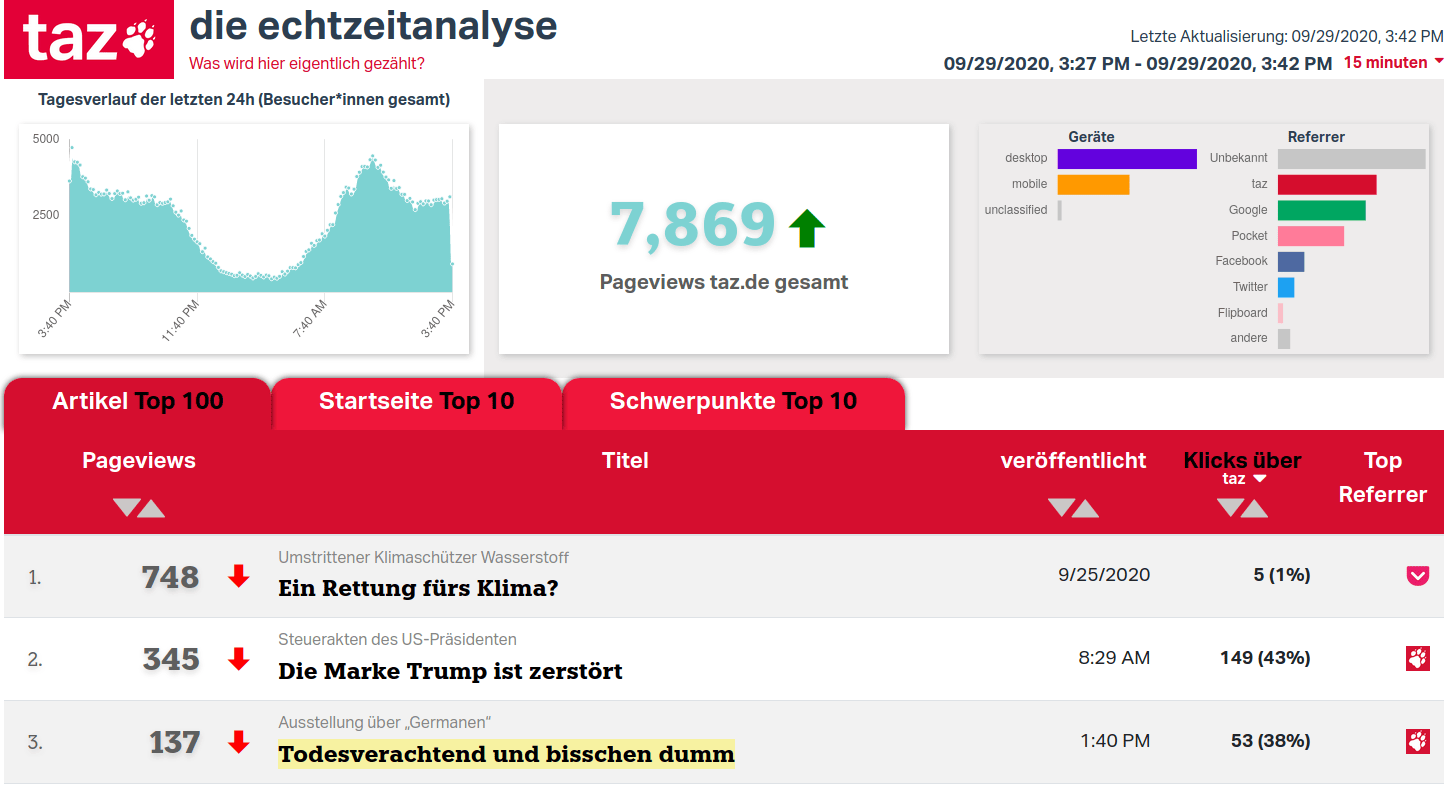
The echtzeitanalyse dashboard
As in all our projects, we focused on communication without detours, concrete agreements and agile software development. In our CI/CD environment, we presented the current development status to our customer early on and consulted them on the current status in close intervals and made adjustments where necessary.
For this project we also relied on extensive testing in all software components and automated review environments with mocked test data to enable the tight feedback loops mentioned above.
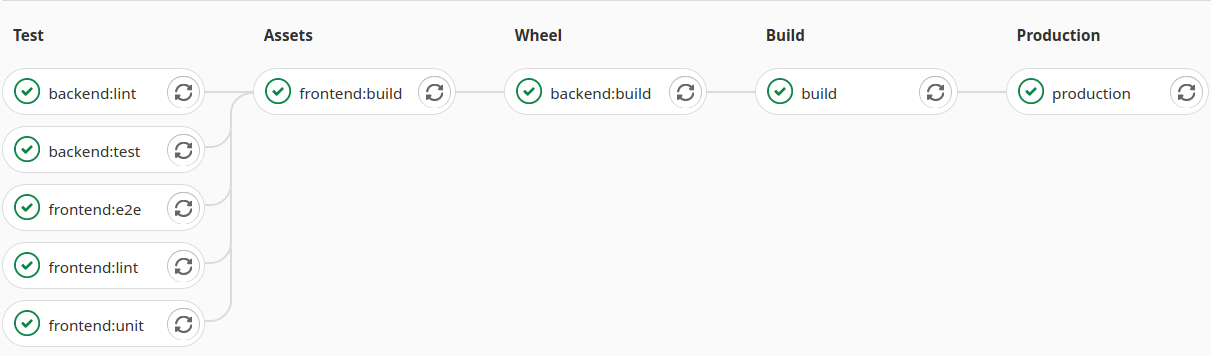
Gitlab CI Pipeline
The echtzeitanalyse is available under a free license and the source code can be reviewed on github .